With so many possible metrics in Google Analytics, you could easily spend all day analyzing, and who has time for that? Get the most out of your analytics by watching these 5 key analytics metrics (and figure out how to interpret them).
Traffic Source
How did your visitors find you?
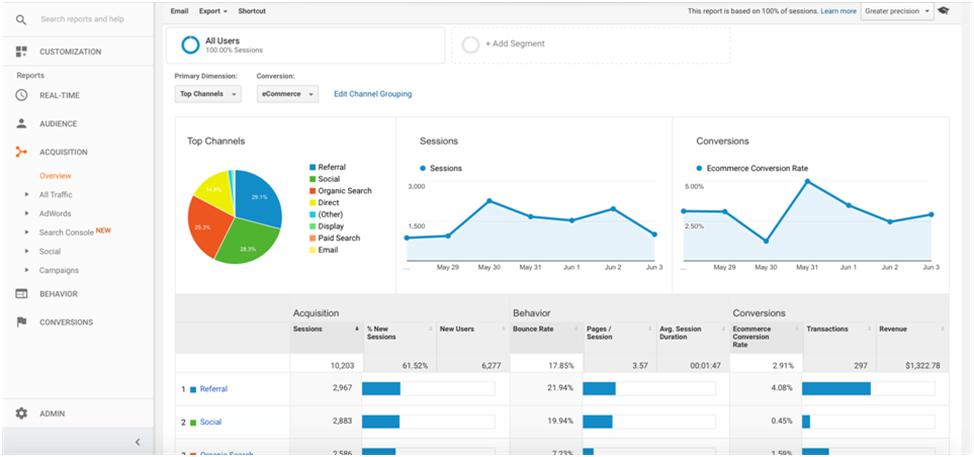
Find this report through Acquisition -> Overview. The Acquisition Overview report details how many people visited your site and where that they came from.
So why does this metric matter? Well, it’s important to have a diverse number of sources for incoming traffic. The three primary source categories are:
#1- Direct Visitors – the ones that visit your site by directly typing your url in their browser address bar
#2- Search Visitors – the ones that visit your site based on searches
#3- Referral Visitors – the ones that visit your site because it was mentioned on another blog or site
TIP: To keep organic search visitors high, you need an effective keyword strategy.
Related Post: How to Set Up Google Analytics on Your Site
Social Media Overview
Which platform gives you the best ROI?
You likely spend a lot of your time on social media, and although it’s fun, if you’re doing it for business it should be giving you something for all that time. This metric shows you which social platform works the hardest for you, in terms of shares, increased followers/traffic, increases in engagement, or a higher conversion rate. You might be surprised at your results!
So how exactly can you measure this? Simply go to Social Overview Acquisition > Social > Landing Pages.
TIP: To track the exact traffic from Instagram shorten your links using Bit.ly and then track the incoming traffic from that specific link.
Time on Page
Is your audience reading what you write?
Do you ever wonder if your users spend time reading through the content you work so hard to create? Few people who read a whole post leave a comment, so this metric is a good clue that people are reading your whole article (or not). When you have a good understanding of what kinds of content capture your audience’s attention you can craft your content around that. Readers don’t always speak up to let you know they’re there, but the time they spent with you does.
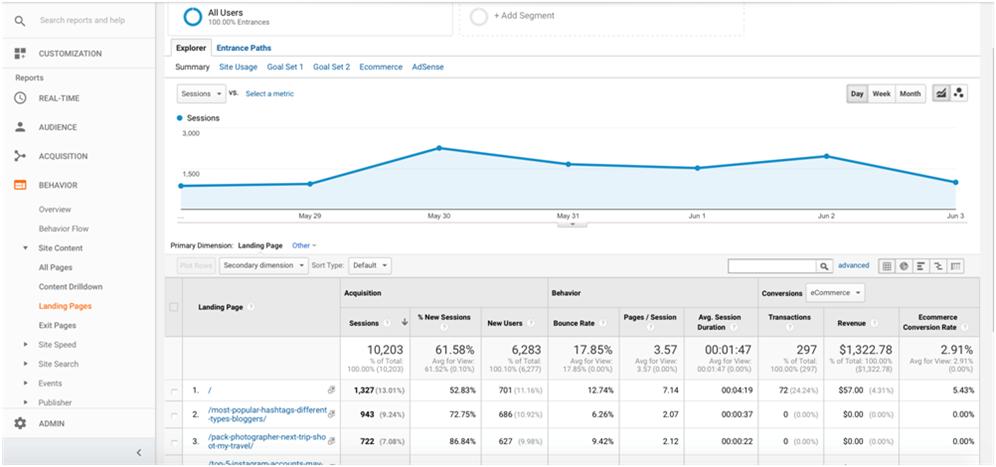
So how can you find the Time on Page metric? Go to Behavior > Site Content > Landing Pages.
TIP: Keep your page engaging by writing rich blog posts, and ask prompting questions at the end of each blog post. Remind your readers that their participation is valuable to the community, and they may be more likely to comment or share content.
Bounce Rate
Did people come to your site by accident?
Bounce Rate is the term used when someone leaves your site without going past the first page. As I’ve written before, bounce rate isn’t inherently bad, but it could be a sign that people aren’t interested in your site, or are somehow coming in by mistake, indicating and SEO problem. This one is an important one to watch, because while a high bounce rate could mean lots of things, a low bounce rate is almost always good. If people are coming to your site and visiting multiple pages, it’s a good sign that you’re doing something right.
To measure Bounce rate, go to Behavior > Site Content > Landing Pages.
Is your audience healthy or stale?
A healthy business has a steady mix of new and repeat visitors, so this metric shows you if you’re wooing new people while keeping the flame alive with your current audience. If you’re building a loyal base, you’ll have lots of repeat visitors; if your marketing efforts are successful you’ll have lots of new visitors.
Do you have any other must-watch metrics? Are any of the metrics here useful to you in a way we didn’t mention? Let us know in the comments below!


